Blog

May
A Dallas Area Home Buyer Had to Pay $300,000 More Than Asking Price For Their New Home
Jason C. 0 comments Dallas
According to an article on WFAA, a Dallas-based TV station, an unnamed home buyer in Southlake, TX just paid $300,000 over the asking price to make sure they secured their dream home. The home was originally listed at $1 million dollars but the real estate market in the region has been going bonanza this year setting new records seemingly every month for average home price.
The real estate agent warned the buyers that there was only a roughly 10% chance that they would be able to close the home if they offered the list price, so they decided to go with a 30% increase over the list price to hopefully have a better chance at winning the deal.
What could be causing this surge in prices? One theory is that due to the pandemic wealthy investor backed cash buyers are making offers on homes over list price and securing them with a quick payment cash offer which home sellers might prefer over a pre-approved bank-backed mortgage deal. Why would cash buyers be doing this? Simple supply and demand, with the economy still slugging through a downturn and inputs like lumber being extremely costly, home values may continue to rise for several years before supply catches up to demand in the Dallas – Fort Worth region. When this happens investor-backed cash buyers can purchase a home at over list price and then bank a 20% to 85% profit when they sell the home in the next year or two.
If you are a home owner and you want to sell your home, this is probably the best seller’s market in DFW we are going to see for some time and you should start planning out how to approach it quickly.
Home values are not an exact science in Texas or really anywhere, and are usually impacted by a lot of factors, including the condition of your home and of course the local demand for a pre-owned home. One of the best ways to increase your home’s reseale value is to remodel either your kitchen or your bathroom(s) according to Don Brunson of Brunson Construction in Dallas. This can make a home appear more modern and up-to-date and have a major impact on how much buyers are willing to pay, even those cash buyers. You might also consider lower cost ideas too like a new coat of paint on the interior walls, new paint or stain on door / window trim and moulding, and hiring a professional landscaper to fix up your lawn, fence line, and any trees or shrubs.
We recommend talking to a real estate agent and planning any repairs or remodeling to get your home in tip top shape before putting it on the market. You probably also want to make sure you have a plan for where you and your family will be moving to before getting your home listed.
Featured photo by Binyamin Mellish from Pexels
Apr
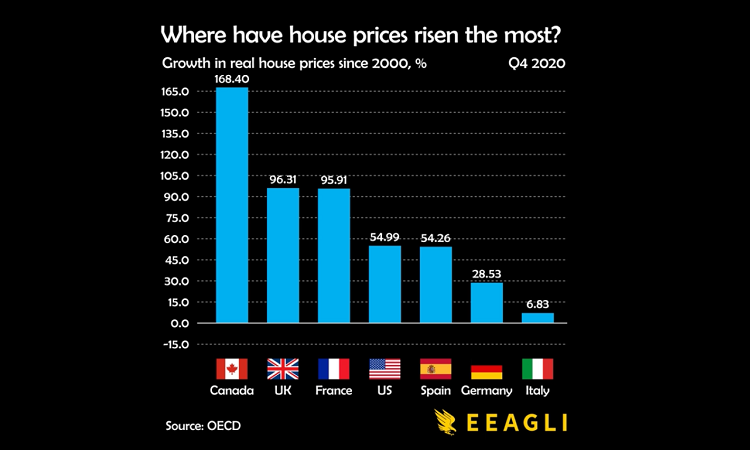
Canada’s Home Prices Have Risen 168.4% Since 2000, USA Home Prices Have Risen 54.99%
Jason C. 0 comments Data Visualization, Home Ownership
[OC] Where have house prices risen the most since 2000? from dataisbeautiful
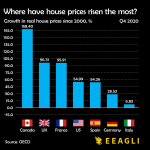
A datavisualization from Reddit user Jcceagle shows how home prices in several countries in North America and Europe have changed since the year 2000. The data comes from the Organisation for Economic Co-operation and Development and has been adjusted for inflation.
Canada came in at the #1 biggest change rising 168.4% bewteen 2000 and 2020.
Here are all of the countries home prices included in the graphic
- Canada – 168.4%
- United Kingdom – 96.31%
- France – 95.91%
- United State – 54.99%
- Spain – 54.26%
- Germany – 28.53%
- Italy – 6.83%
Home prices rise for a variety of reasons including foreign investors buying property, homes being purchase for vacation or short-term rentals, and various other factors. It is clear from the this graphic htat some countries are experiencing major problems controlling the factors that contribute to exorbidant rises in home prices.
This is a ‘bar chart race’ data visualization which means you can watch the figures change over the 20 year time span and see precisely when each country’s home values experienced major rises.
Mar
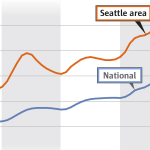
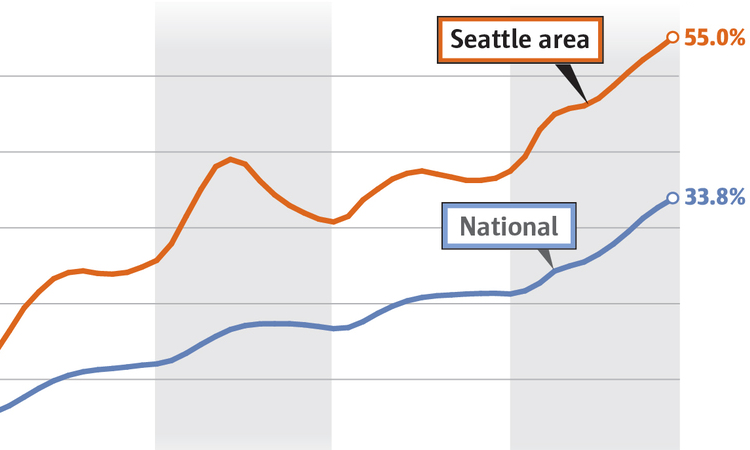
If you are looking to move to Seattle, WA you may want to start house hunting earlier than you had anticipated. The housing marketing in Seattle and the surrounding area is red hot right now with home prices growing by double-digit increases year over year for the first time since 2014.
In December of 2020 the price of a home in the Seattle area rose 13.6% over December of 2019. In December of 2019 home prices in the Seattle area were only up 4.1% year over year.
According to an article by the Seattle Times home prices in Pierce County are growing the fastest, with the price for a house in Parkland, WA rising 19.2% and the price for a house in Tacoma, WA rising 17.5%.
Overall since 2015 the price for homes in the Seattle area have risen by 55%.
While this is a great time to be a home seller in Seattle or surrounding communities, it is not so great for those seeking to move to Seattle or buy a home. An article by Komo News cites a broker who says their client offered 15% over asking price but ended up 12th in bidding order for a home in West Seattle.
The same article cites a Texas couple moving to Seattle who realized the boom was happening and abandoned their hopes of finding a home in Seattle itself, instead looking at the suburbs for a lower priced home knowing they will have to pay more than asking price for it.
Featured image a cropped version of a chart of Seattle home price percentage changes compared to the National average since 2015 by the Seattle Times. Read their linked article above to see the full chart.

Jul
The great thing about starting a business is that the barriers to entry are low. It’s part of the American dream. And although the barriers are low, the business owner will need to spend countless hours on building the company. That being said, certain cities across America seem to be better than others when it comes to startups. And, according to Crowdspring, Seattle is among the best cities in the countries to start a business in. Read on to find out why.
Seattle and Startups
To get started, let’s take a took at the full list of great startup cities, in no particular order:
- Seattle, WA
- Austin, TX
- Boulder, CO
- Miami, FL
- Los Angeles, CA
- San Francisco, CA
- Provo, UT
- Las Vegas, NV
- Denver, CO
- Chicago, IL
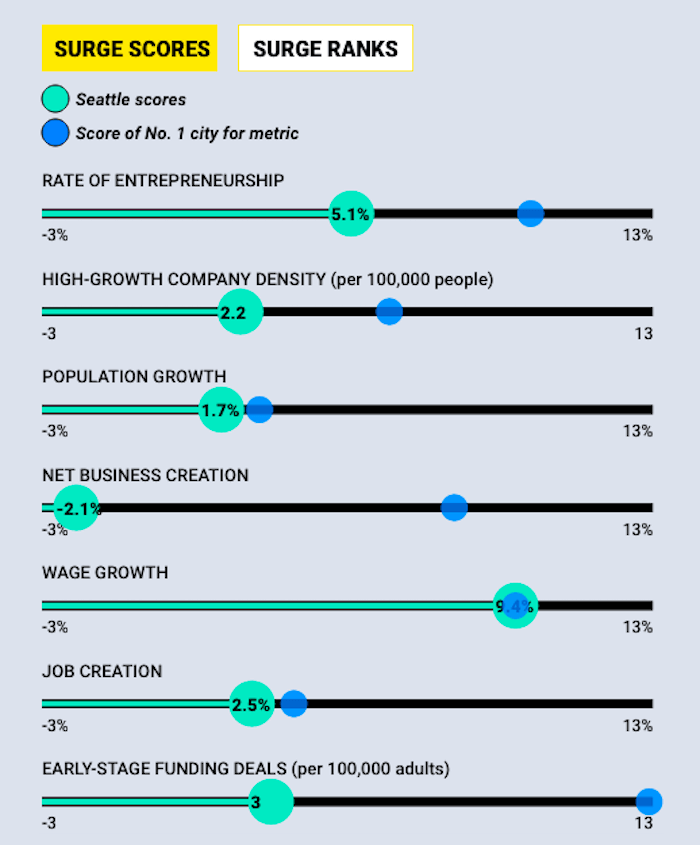
So, what makes Seattle better then New York City, or Tampa, or San Diego? To get a hint, check out the photo below about Seattle’s “Surge Cities Index”.
Job creation, population growth, early-stage funding deals, and more are all positive (more than zero, or, not in the negative numbers).
Amanda Bowman of Crowdspring writes, “Seattle has been among the fastest-growing cities in the United States since 2010, and its population is expected to increase by an additional 200,000 over the next 20 years. A young, vibrant population, a booming tech industry and a run of interesting restaurants, unique shops and coffeehouses are among the reasons for the increase in start-up traffic in Seattle.”
This pretty much says it all. When you have a city, especially a large one like Seattle, that is growing so quickly, it’s only a matter of time until people start opening businesses and forming companies. Seattle’s popular will grow by a nice 200,000 residents over the next 20 years. Surely a few of those (and probably more!) people will be working on startups within the city.
Amanda Bowman continues, “Seattle doesn’t offer major tax incentives for entrepreneurs, but it does have plenty of venture capital firms and economic development ventures to help foster the development of small businesses and start-up companies.” And while Seattle doesn’t offer any major tax incentives yet, that may change. The silver lining in that quote is that there are numerous venture capital firms and economic development ventures which will help give startups their initial push.
Featured photo by Pexels on Pixabay

Jun
Renters in Chicago and New York are fleeing south for Dallas
Jason C. 0 comments Dallas, Moving News
We see it time and time again: People are migrating to Texas from other areas of the United States. Specifically, we see people migrating from Seattle, Los Angeles, New York City, and Chicago. In this blog post, we’re going to cover migrating that specifically originates from Chicago. New York City, and San Antonio. Where are they going? They are moving to the Dallas-Fort Worth area! WFAA has the full story. Let’s see what they found.
Migration Data
The information comes from Apartment List. Bill Hethcock of WFAA writes, “4.8 percent of DFW apartment searches on the Apartment List site are coming from renters in New York. Another 4 percent are coming from San Antonio, and 3.6 percent are from Chicago.”
When people search for apartments to live in, especially when they aren’t in the area, that means they’re considering moving to where ever the apartment is. In this case, potential renters are looking to move to Dallas-Fort Worth.
4.8, 4, and 3.6 percent don’t seem like large numbers; however, how many major cities are there? Let’s just say there are 20 major cities. 20 times 4 (percent) is 80%. So, are we to believe that only 20% of apartment searches for Dallas-Fort Worth are happening in an around Dallas-Fort Worth? No. I’m sure most apartment searches are happening in and around the Dallas-Fort Worth area. That makes the 4.8% (etc) searches seem even larger.
Why Dallas-Fort Worth
People migrate for different reasons. For some, people move to an area to escape crime or poverty. Others move to an area because they want to raise a family and there are good schools around. With Dallas-Fort Worth, it seems like an answer of “all of the above”.
Bill Hethcock continues, “Dallas has enjoyed significant economic growth in recent years while retaining an affordable cost of living — this is an increasingly rare balance among major American metropolitan areas,” economist Chris Salviati wrote in an email. “While New York has long had one of the nation’s most dynamic economies, the cost of living is also among the nation’s highest. Chicago, on the other hand, is relatively affordable but has experienced much more stagnant economic growth.”
So there you have it. Major cities like Chicago and New York have an extremely high cost of living. Sure, people get paid more on average. But in the Dallas-Fort Worth area, new residents can get the best of both worlds: a lower cost of living coupled with a good salary. In addition, neighborhoods in and around Dallas-Fort Worth are great places to raise a family.
The trend of migration towards the Dallas-Fort Worth area is one that’s been happening for years. Because of this, businesses are thriving which allows them to hire more people. These people will spend their money within the Dallas-Fort Worth area and it will circulate within the local economy. And that’s why migration to Dallas-Fort Worth will continue in the years to come.
Featured photo by Vincent Groeneveld on Pixabay

Jun
The look and feel of a city is important. A city that looks visually appealing will help attract new residents. On the other hand, a city that looks worn down or otherwise unappealing will repel possible new residents. The skyline is a distinct feature of a city. It’s what the city looks like from a distance. USA Today asked their readers to vote on the best skyline. Guess who won? Dallas did!
In this post, we’re going to describe the runners up and why Dallas was chosen as having the best skyline in the world. Let’s get started!
Dallas is Number One
USA Today writes, “The highly recognizable cityscape – regularly featured in the 1980s hit series ‘Dallas’ and other more recent reality shows – took a strong majority of votes, despite stiff competition from #2 finisher Chicago. In recent years, Dallas has added colorful interactive lighting to its skyline, giving it 8 extra hours per day to impress travelers.”
Imagine flying on an airplane just after dark. Once you approach a city, the lights are interactive, unique, and eye-catching. You might ask “what city is this?”. The answer is Dallas. This is a question that’s asked by numerous travelers. As a matter of fact, DFW is one of the busiest airports in the country.
The Top 10 and the Others
We already know that Dallas has the top spot and Chicago is in the number two spot. Chicago is another very recognizable city. Navy Pier, the John Hancock tower, and the Willis Tower (although some residents still swear by calling it the Sears Tower) are landmarks of the city. How about the other eight cities. Here’s the full top ten list:
- Dallas
- Chicago
- Rio de Janeiro
- Toronto
- New York
- Washington, D.C.
- St. Louis
- Hong Kong
- San Francisco
- Seattle
It’s interesting to note that most of the cities on the list are located within the United States. Only three—Rio de Janeiro, Toronto, Hong Kong—are located outside of the United States.
There were additional cities that didn’t make the top ten list; however, they were close. It’s also interesting to note that just about all of them (except for Las Vegas) are located outside of the United States. The additional cities, in no particular order, are:
- Abu Dhabi
- Dubai
- Kuala Lumpur
- Las Vegas
- London
- Paris
- Shanghai
- Sydney
- Toronto
- Vancouver
Featured photo by Skeeze on Pixabay

Jun
Question: Who still has a landline phone? Short answer: a lot of people. Sure, the tide is turning against landlines in favor of cell phones. This has been happening ever since cell phones started to become popular. Now, and thanks to Overflow Data, we have the numbers of which states have the most wireless only households. Let’s check out their findings.
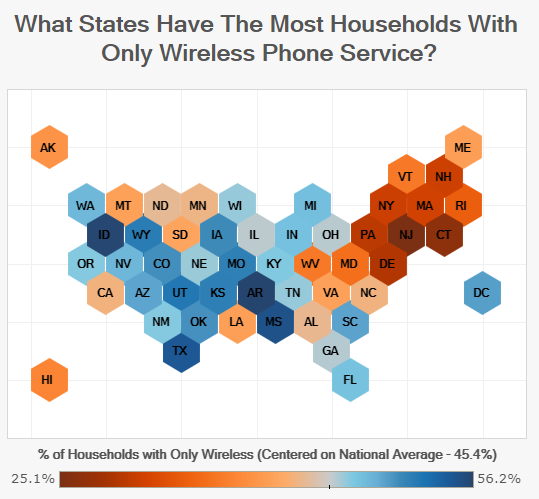
Map of the States
The visualization above is essentially a map of the United States. It doesn’t show the shape of the states; instead, the states are represented by colors on a moving scale from red to blue.
The red states are the ones with less wireless only households. There is no landline “telephone” within more of those homes in the blue states.
According to Chase from Overflow Data, “An increasing number of households are making the switch to only having wireless home service. The CDC tracks this in the National Health Interview Survey and estimated that at the end of 2014, 45.4% of households only have Wireless phone service.”
A few things can be surmised by looking at the map visualization. One is that the states with fewer landlines in the middle of the country. The states on the east coast have more cell phones. States like South Dakota, Louisiana, and West Virginia are the outliers. These three states lean towards having more households with landlines.
Percentages of only Wireless Service
In this section, we’re going to talk about the states in order of wireless phone service. More specifically, we’re going to list them from most wireless only to least wireless only. We’ll also include the standard error percentage that was found during the study. Let’s get started!
- Arkansas – 56.2%; SE – 2.2%
- Idaho -56.1%; SE – 2.0%
- Mississippi – 55.1%; SE – 2.2%
- Texas – 54.6%; SE – 1.1%
- Utah – 52.2%; SE – 2.0%
- Wyoming – 51.8%; SE – 1.3%
- Kansas – 51.6%; SE – 1.9%
- Missouri – 51.5%; SE – 2.1%
- Iowa – 50.7%; SE – 1.7%
- Colorado – 50.5%; SE – 1.9%
- Oklahoma – 50.4%; SE – 1.9%
- District of Columbia – 49.7%; SE – 2.2%
- South Carolina – 49.5%; SE – 2.1%
- Arizona – 49.4%; SE – 2.1%
- Nevada – 48.4%; SE – 2.0%
- Washington – 48.3%; SE – 1.9%
- Michigan – 47.8%; SE – 1.7%
- Indiana – 47.7%; SE – 2.0%
- Florida – 47.6%; SE – 1.3%
- Kentucky – 47.1%; SE – 2.0%
- New Mexico – 47.0%; SE – 2.3%
- Oregon – 47.0%; SE – 1.9%
- Tennessee – 46.6%; SE – 1.9%
- Wisconsin – 46.6%; SE – 1.9%
- Nebraska – 46.5%; SE – 1.9%
- Georgia – 45.9%; SE – 1.7%
- Ohio – 45.8%; SE – 1.6%
- Illinois – 45.7%; SE – 1.5%
- North Dakota – 43.6%; SE – 1.9%
- Alabama – 43.4%; SE – 2.3%
- Minnesota – 43.1%; SE – 1.9%
- North Carolina – 42.9%; SE – 1.7%
- California – 42.8%; SE – 0.9%
- South Dakota – 41.4%; SE – 2.0%
- Virginia – 41.1%; SE – 1.9%
- Montana – 41.0%; SE – 2.4%
- Louisiana – 40.9%; SE – 2.2%
- Maine – 40.8%; SE – 2.2%
- Alaska – 39.7%; SE – 2.2%
- Hawaii – 38.3%; SE – 1.8%
- Vermont – 37.2%; SE – 1.9%
- West Virginia – 37.2%; SE – 2.2%
- Maryland – 36.2%; SE – 1.9%
- Rhode Island – 34.6%; SE – 2.0%
- Massachusetts – 31.5%; SE – 1.8%
- New Hampshire – 31.2%; SE – 1.5%
- New York – 31.1%; SE – 1.1%
- Pennsylvania – 30.0%; SE – 1.4%
- Delaware – 29.4%; SE – 1.9%
- Connecticut – 26.7%; SE – 1.7%
- New Jersey – 25.1%; SE – 1.5%
Here are the top 5 states with households having more wireless only phone service: Arkansas, Idaho, Mississippi, Texas, and Utah. And here are the 5 states with households having less wireless service: New Jersey, Connecticut, Delaware, Pennsylvania, New York, and New Hampshire.
Landline and Wireless Phone Facts
According to Statista, 2015 was the year which half of all households had a landline and half had a cell phone only. This may come as a surprise to many people because 2015 was only a few years ago. Cell phones have taken over as the more popular choice. Landlines will likely never recover.
Do you know of anyone with a landline telephone? It’s a question still asked on my official forms that you would fill out at places like a doctors office. Landline
Felix Richter of Statista writes, “In 2004, more than 90 percent of households in the U.S. had an operational landline phone – now it’s little more than 40 percent. That’s according to data provided by the Centers of Disease Control and Prevention, which has been tracking phone ownership in the U.S. as a by-product of its biannual National Health Interview Survey since 2004.”
The percentage of households with a landline was 41.7% in 2018. By the time you’re reading this, that number is like 40% or below. Within the next decade, if the trend keeps its pace, we imagine there will only be around 20% of households with a landline.
Featured photo by Monoar Rahman Rony on Pixabay
Jun
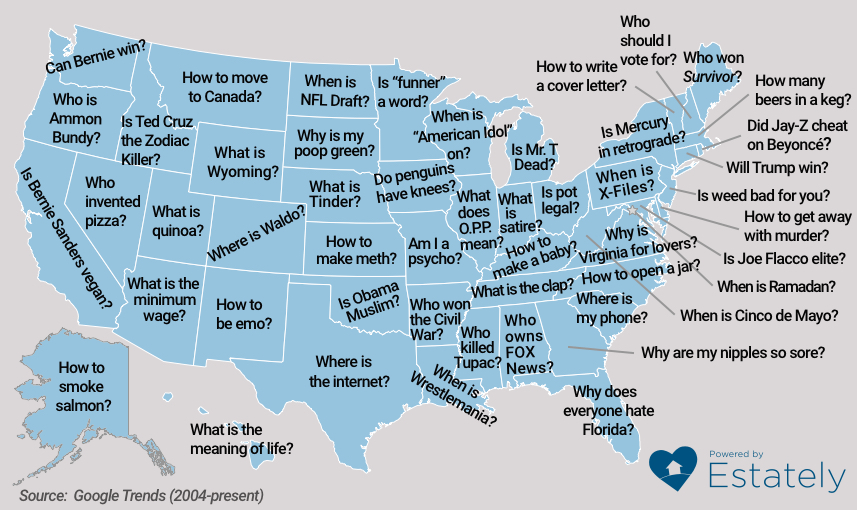
American have questions! And each state has a “most popular question”. Some of the questions are quite hilarious. Others are intriguing or downright scary. In this blog post, we’re going to examine what some of these questions are. The questions come from Google Trends and were reported by Estately.
The Funny Questions
Let’s just jump right in. In this section, we’ll cover some of the more funny questions, starting with this: “Is funner a word?”. Now, I know what you’re thinking. It’s not necessarily a “funny” question; however, it definitely related to the subject. This question comes from the residents of Minnesota.
“Is Ted Cruz the Zodiac Killer?” This is arguably a pretty funny question and topic (if you have a dark sense of humor). The Zodiac Killer is a serial killer who hasn’t been caught. Internet sleuths noticed some similarities between what’s known as the Zodiac Killer and Ted Cruz (former presidential candidate and current Texas Senator). Last year, Ted Cruz thought it would be funny to join in on the fun. He posted a tweet and wrote “Happy Halloween” with a photo of the Zodiac Killer’s symbol writing. This question comes from Idaho. See the tweet below.
Happy Halloween pic.twitter.com/jIgTaIMzep
— Ted Cruz (@tedcruz) October 31, 2018
“What is Wyoming?”. Alright, this question is being included here for one big reason: The question is coming from residents of Wyoming! Answer: the state you live in.
The Strange Questions
In this section, we’re going to go over some of the more off-ball questions people have. And remember: These questions are the most popular question in that state. Keep that in mind.
“Do penguins have knees?”. Sure, it’s a valid question! But why would the residents of Iowa be asking it? There are no penguins in Iowa! At least there aren’t in the wild. Perhaps you can find some in a zoo. If you’re wondering, the answer is yes, penguins do have knees.
“How to be emo?”. This great question comes from the residents of New Mexico. And this question is a good sign that business owners should be investing in Hot Topic and Spencer’s locations around the state. More information regarding this question doesn’t list the age of people asking the question; however, I think it’s safe to assume that this question is mostly being asked by younger teens.
The Scary Questions
In this section, we’ll talk about the more popular, scary questions. These aren’t questions like “are ghosts real”; instead, they are questions where, if you knew who was asking them, you might want to avoid them.
And here’s the first question: “Am I a psycho?”. This question comes from residents of Missouri. We hope that the answer to this is “no”.
“How to make meth?”. This question comes from the residents of Kansas. Gosh, it’s quite surprising that this is the most popular question in any state. If we were to guess, this question would be most popular in New Mexico, not Kansas. And it isn’t because meth is most popular in the state. Instead, it’s because that’s where the fictitious setting of the popular show Breaking Bad takes place.
“How to get away with murder?”. Yes, if you know someone who’s asking this question, you might want to steer clear of them. This question is the most popular question in Delaware.
“How to make a baby?”. We included this question in the scary section because if this question is the most popular one in any state, it is scary. This question comes from the residents of Kentucky. We’re hoping that this internet search educated them on this very important question.
The Smart Questions
The questions in this section are more “normal” and would seem to be questions the average person would ask. Let’s see what some of these are.
“What is quinoa?”. Good question! Quinoa is an extremely delicious and healthy. This question comes from the residents of Utah.
“How to smoke salmon?”. This is another great question and very fitting since it comes from the residents of Alaska. Salmon is abundant in the state and the people here are asking the right questions. At least, the most popular question in the state seems to be that.
“How to open a jar?”. This is another functional question and one that might be asked by more of the elderly residents of the state. Here’s a tip: if a jar is difficult to open, bang the sides of the lid with a kitchen utensil. It will help loosen it and make it easier to open. This question comes from the residents of North Carolina.
“Who won the Civil War?”. It’s important for residents of any state to ask questions like these. Wars such as the Civil War shouldn’t be forgotten. History repeats itself; however, if people remember the past, perhaps the bad parts (civil war) won’t have to be repeated. This question comes from the residents of Arkansas.
The last question we’ll cover is one that has many answers, depending on who you ask: “What is the meaning of life?”. This is a question that has been asked by residents in all cities, states, and countries for as long as humans have been alive. This great question comes from the residents of Hawaii.
We have the full map of questions for your reading pleasure. Check out the screenshot below to read the rest!
Featured photo by Gordon John on Pixabay
Map of questions is a screenshot from Estately

May
Some cities are better than others when it comes to rental housing codes. And some cities are worse. Case in point: Dallas now has the most difficult rental housing codes in the entire State of Texas. Dallas News covered the story and tell us what this means for landlords and renters.
Tightening the Rules
In business, tightening the rules is good for some but not so good for others. For example, mandating companies to comply with additional rules cost manpower, time, and sometimes money. On the other hand, these rules are often good for employees and customers. For example, additional on-the-job safety regulations costs money; however, they better protect employees. The new rules for landlords in Dallas work in a similar way.
Tristan Hallman, Dallas Hub Editor, writes “Dallas leaders say renters will be less susceptible to slumlords after the City Council voted Wednesday to overhaul the city’s housing standards and require code inspections of single-family rental homes for the first time. The new minimum housing standards also include more stringent air-conditioning requirements, better contact information for landlords and tougher code inspection rules.”
Who has to pay for the code inspections and air conditioner checks? The landlords do. That means renters will benefit. But renters aren’t the only ones who will benefit. Think of the code inspectors and HVAC companies. Landlords are now their new customers. Business will soon be better for HVAC and code inspection companies!
Helping Renters Live Better
Here’s an interesting tidbit from the article: 56% of all residents in Dallas are renters. These new housing codes will be affecting all renters. That’s a lot of people! That means their quality of life will soon improve once improvements begin after the inspections, if need be.
The new regulations will help renters like Iris Romo. Tristan Hallman writes, Iris “remembers when the stove broke at her apartment. She said she called the office to request a replacement but got a slow response. Romo said her landlord finally replied, “Good, you get to eat out!” The apartment complex eventually fixed her stove, which then broke again two weeks later. Others have shared their horror stories with the council in recent months. The result is that landlords will be required to repair appliances, provide better lighting, allow city code inspections and take care of pests.”
Imagine living in an apartment and the landlord tells you that you get to eat out now. What if you had a family? It would be too expensive for many, if not the majority of people. And to say something like that, without fixing the problem, is extremely brash. Now, these landlords no longer have choice if they want to repair certain fixtures, or not. The new rental housing codes are a major win for all renters living in the Dallas area.
Finally, the City of Dallas is also benefiting from these new regulations. That’s because landlords now have to register their rental property with the City of Dallas once each year. The fee for registering their rental property is $21.
Featured photo by Succo on Pixabay
May
Have you ever wondered which cities are up-and-coming and trending? New York, Chicago, Miami, and Los Angeles are the largest major cities in America; however, a couple of these cities—specifically, New York, and Chicago—have a net negative population migration. NerdWallet was able to compile the internal migration data for the entire country. Some of the data, such as with New York and Chicago, may surprise you.
In this article, we’re going to talk about where people are moving from and moving to. We’ll even get into average and owning costs within the cities these people are moving from and moving to. Finally, we’ll detail the methodology that NerdWallet used to put together their information.
Featured Data and Information
Let’s start with the big winners when it comes to population moves: Tampa and Phoenix. These two cities have gone from large to major cities, partly because of the massive influx of new residents. Elizabeth Renter of NerdWallet writes, “the Tampa, Florida, and Phoenix metro areas had the highest share of out-of-state newcomers who were homeowners (41%), compared with an average of 32% among all metros analyzed”.
Tampa has a yearly net migration of 48,905. 147,503 are newcomers to the city and 98,598 people move away, on average. Phoenix, on the other hand, has a yearly net migration of 88,942. 219,938 are newcomers to the city and 130,996 people move away, on average. Clearly, there’s more movement in and out of Phoenix but Tampa has plenty of action as well.
Renting and Owning
The total cost to rent or own is an important factor in choosing to move to a certain area. What’s even more important, however, is the percentage of income needed to rent or own.
Elizabeth Renter writes, “Homeowners with a mortgage spent 18-22% of their household income on ownership costs in most of the metros examined while renters spent 30-33%. In all of the metros analyzed, the median homeowner income was more than twice the median renter income.”
If this were the only data needed, it’s clearly a better decision to own rather than rent. After all, why would someone pay 30-33% of their income on housing when they would only have to pay 18-22%?
Let’s examine some major cities where owning and renting costs the least as a percentage of total income. We can start with the Charlotte Metropolitan Area. Here it costs an average of 18% to own and an average of 29% to rent as a percentage of income. What about the St. Louis area? Here, it costs an average of 18% to own and an average of 30% to rent as a percentage of income. The Minneapolis area is another major city where people are getting their bang for their buck. There, it costs an average of 19% to own and an average of 29% to rent as a percentage of income.
Methodology in Obtaining Data
NerdWallet was able to create a table and a map based on the data they used. The data actually comes from more than one source. Information from the Home Buyer survey, the American Community Survey, the American Housing Survey, and the U.S. Census Bureau was used.
Elizabeth Renter writes, “NerdWallet’s Home Buyer survey was conducted online within the U.S. among 2,029 U.S. adults ages 18 and older by The Harris Poll from Jan. 16-18, 2019. Migration data comes from the 2012-2016 American Community Survey five-year estimates and approximates the number of people who moved for any one-year period within that period. As defined by the U.S. Census Bureau, monthly housing costs for homeowners include all mortgage, home equity loan, real estate taxes, insurance, utility and fuel payments.”
NerdWallet, therefore, used four sources to put together their comprehensive housing and migration analysis.
Lastly, let’s take a look at NerdWallet’s interactive migration map. The following major cities are included:
- Atlanta
- Baltimore
- Boston
- Charlotte
- Chicago
- Dallas
- Denver
- Detroit
- Houston
- Los Angeles
- Miami
- Minneapolis
- New York City
- Orlando
- Philadelphia
- Phoenix
- Portland
- Riverside
- San Antonio
- San Diego
- San Francisco
- Seattle
- St. Louis
- Tampa
- Washington, D.C.
Featured photo by Gordon Johnson on Pixabay
U.S. Migration map is embedded from Nerd Wallet

