Blog

Aug
Homelessness is an ongoing problem for many people and communities. Mental illness, poverty, domestic abuse, laziness—these are some common reasons people become homeless. Statista recently created the chart below which details the cities that have the highest number of homeless people.

Interpreting the Numbers
A quick glance at the chart shows a shocking number of homeless people. Half a million people would fill ten major sports arenas! Digging a little deeper, however, shows that the number is comparatively small compared to how many people there are in the United States. The United States Census Bureau states that the population is just over 328 million. That means only 0.17% of people here are homeless. While the percentage is small, it’s still about 0.17% too much.
The Census Bureau also lists the most populous states. Four of them, in order, are California, Texas, Florida, and New York. How does this match up with our chart? Four of the ten are cities in California. New York, while only having one city in the chart (New York City), is by far the winner (or loser) when it comes to the highest number of homeless people that live in any particular state.
Percentages Against Total Number of Homeless
Statista lists the ten cities with the highest number of homeless. Adding those numbers will net 192,535 homeless people, which is nearly 35% of the total homeless in the United States. This makes sense since we learned earlier that California and New York, a couple of the most populous states, have cities with a high number of homeless people.
Let’s take a look at how the ten cities compare again the total number of homeless.
Total Number of Homeless: 553,742.
- Philadelphia: 1%
- Boston: 1.1%
- Las Vegas/Clark County: 1.2%
- San Francisco: 1.2%
- San Jose/Santa Clara City & County: 1.3%
- District of Columbia: 1.3%
- San Diego City and County: 1.7%
- Seattle/King County: 2.1%
- Los Angeles City & County: 10%
- New York City: 13.8%
What’s striking here is that most of the cities seem to have similar percentages. Statistically, Los Angeles and New York City see large jumps and can be considered the outliers of the sample. However, we need to take into consideration that those two cities are massively larger than the others in terms of size and population.
Percentages Against Total Number of Homeless Within Top Ten
Another way of looking at the data is to compare the numbers within each other. For this we won’t take into consideration the total number of homeless; however, we’ll use 192,535. As we learned earlier, that is the sum of the number of homeless from each of these ten cities. Here’s what we get:
- Philadelphia: 3%
- Boston: 3.2%
- Las Vegas/Clark County: 3.4%
- San Francisco: 3.6%
- San Jose/Santa Clara City & County: 3.8%
- District of Columbia: 3.9%
- San Diego City and County: 4.8%
- Seattle/King County: 6%
- Los Angeles City & County: 28.7%
- New York City: 39.7%
While Los Angles and New York City are still the outliers, this gives us a somewhat clearer picture of the data. The two large cities command roughly 68.4% of the total homeless within the top ten cities.
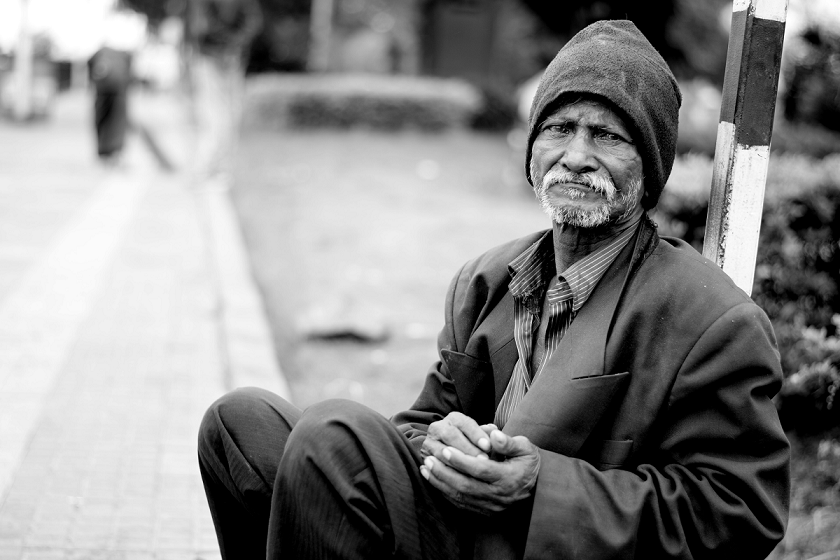
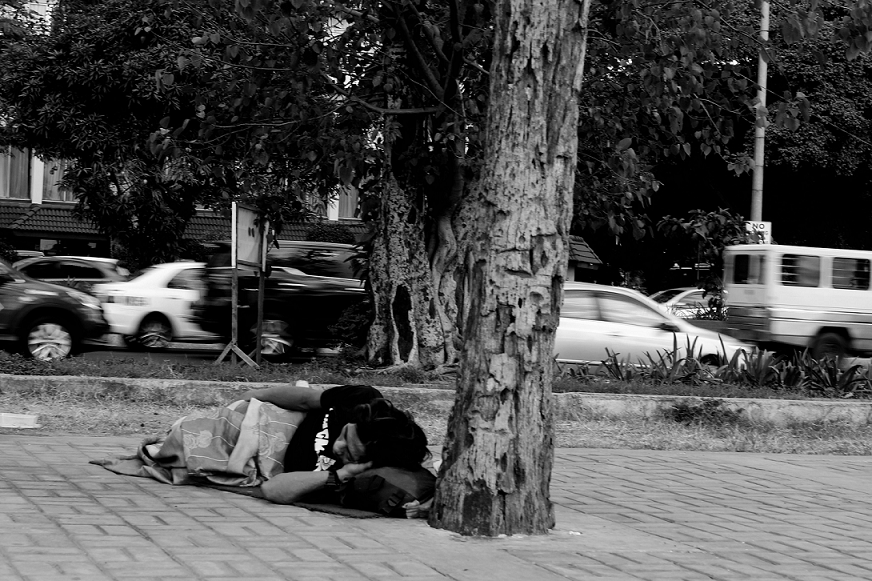
Featured photo by Pixabay and sleeping homeless man photo by Alvin Decena on Pexels


