Blog

Mar
Where in the USA Renters Spend More Than Half of their Income On Rent
Joe Youngblood 0 comments Maps, Moving News
If you’re one of the estimated 40 million Americans moving this year, there’s a good chance you might end up renting a new apartment, condo, townhome, duplex, or house. One issue that’s been getting more attention lately is how much of their income renters are spending on rent instead of saving or spending on other things. The more that is spent on rent, which doesn’t help consumer’s credit scores, the less that is able to be placed into long-term savings, paid on education loans, invested in markets, or spent on consumer items.
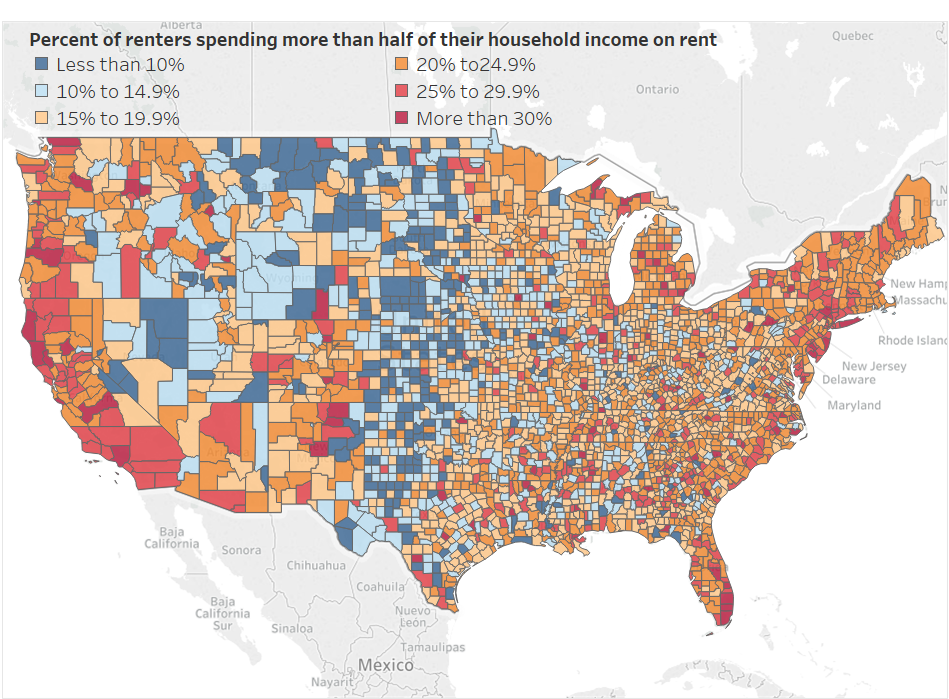
Based on a new map you may want to consider moving into a lower populated area if possible. The map was made by Reddit user /u/academiaadvice and shows counties in the USA color-coded by where residents spend x% of their income on rent. The red and dark red areas indicate where a population spends over 25% of their income on housing rent, something most financial experts advise not to do. These counties almost perfectly line up with population density maps showing the more congested an area is, the more likely a renter is to pay a larger percentage of their monthly income in rent.
Out of all of the states California appears to be the worst for renters along with New York, Washington, Oregon, Arizona, and Florida. Some of the more affordable states include Texas, Oklahoma, Kansas, Nebraska, Utah, Montana, and Missouri.


